Why do top business graduates understand the bell curve? Learn normal distribution and how to use the 68-95-99.7 rule in business decisions.

Why Every Business Graduate Must Understand Normal Distribution
In the world of business, decisions are rarely made on intuition alone. Whether it is evaluating market research, measuring product quality, analyzing employee performance, or forecasting demand, data plays a central role. Among the many statistical concepts used to interpret this data, normal distribution—often visualized through the bell curve—stands as one of the most important foundations for business graduates to understand.
Normal distribution is not just a topic you study to pass exams. It is a tool that quietly sits behind many of the reports, dashboards, and research papers that influence real-world business decisions. Understanding it gives graduates the ability to read data with clarity rather than confusion.
What Is Normal Distribution and the Bell Curve?
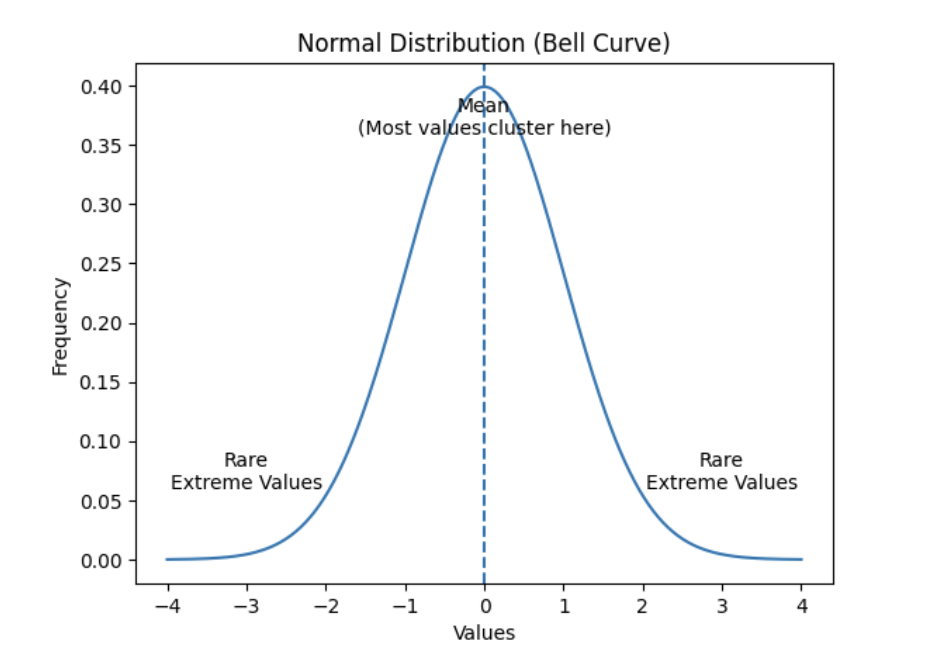
A normal distribution is a pattern in which data points are symmetrically distributed around a central value, known as the mean. When plotted on a graph, this distribution forms a smooth, bell-shaped curve—hence the term bell curve.
In a normal distribution:
- Most observations cluster around the average.
- Fewer observations appear as you move away from the mean.
- Extreme values (very high or very low) are rare.
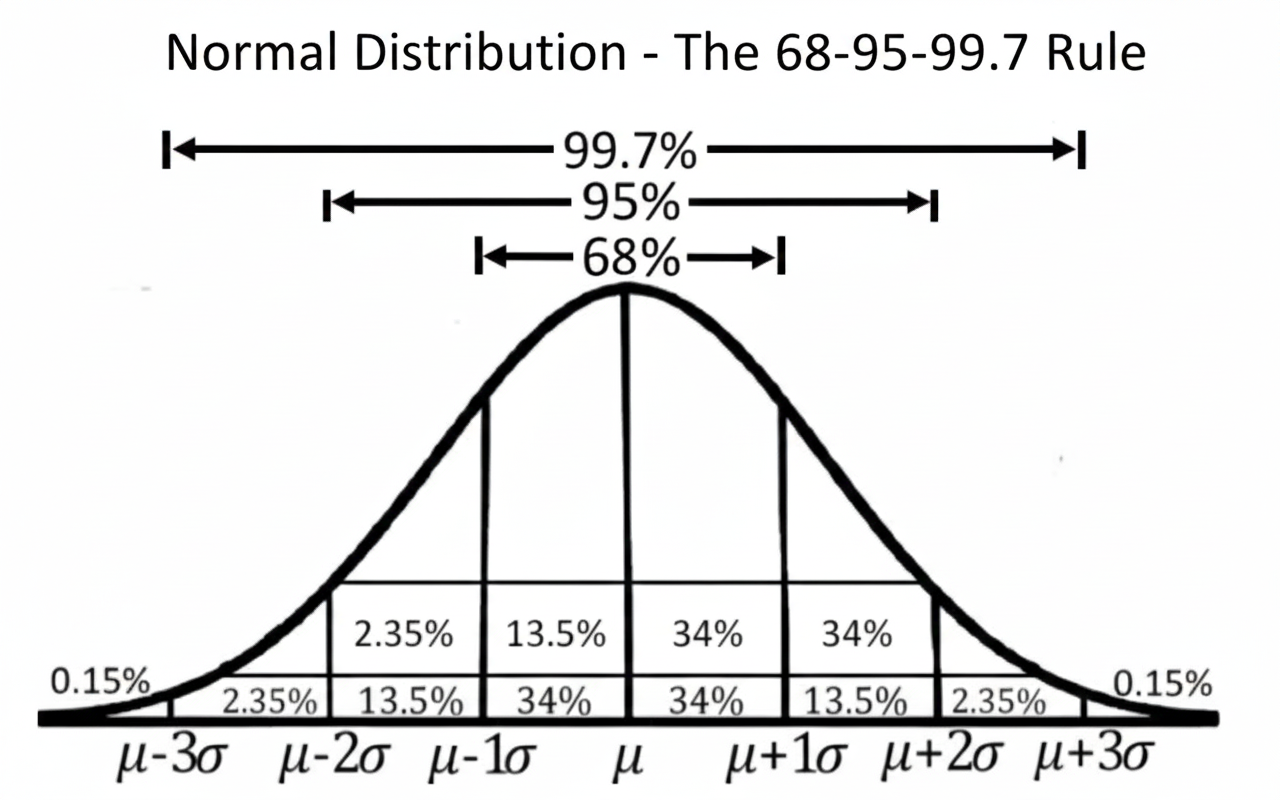
One of the most powerful properties of the normal distribution is the 68-95-99.7 rule:
- About 68% of data lies within one standard deviation of the mean.
- About 95% lies within two standard deviations.
- About 99.7% lies within three standard deviations.
For business graduates, this means that once you understand the mean and standard deviation, you already have a strong sense of how the entire dataset behaves.
Benefits of Understanding Normal Distribution in Business
Knowing how normal distribution works offers several practical advantages in business and management:
Better Decision-Making
Normal distribution helps managers distinguish between what is normal variation and what is truly unusual. This prevents overreacting to minor fluctuations and allows focus on meaningful changes.
Quality Control and Defect Analysis
Manufacturing and service industries rely heavily on the bell curve to monitor defects, delivery times, and service errors. If outputs follow a normal distribution, businesses can predict defect rates and improve processes efficiently.
Performance Evaluation
Employee productivity, sales figures, and performance ratings often follow approximate normal distributions. Understanding this helps managers set realistic benchmarks and fair evaluation criteria.
Research and Forecasting
Market research studies frequently assume normality when estimating customer behavior, pricing sensitivity, or demand. Graduates who understand this assumption can better interpret survey results and forecasts.
What Normal and Non-Normal Data Tells Us in Business Research
In business research, the distribution of data often reveals more than the raw numbers. When data follows a normal distribution, it usually reflects stability and consistency in the underlying process. Most values cluster around the average, making the mean a reliable indicator and allowing decision-makers to confidently apply statistical tools for analysis, forecasting, and evaluation.
Normally distributed data supports common techniques such as hypothesis testing, regression, and confidence intervals. For example, production output that forms a bell curve suggests controlled operations, while normally distributed customer satisfaction or assessment scores indicate balanced performance and fair measurement systems. In such cases, variations are expected rather than alarming.
When data is not normally distributed, it often signals the presence of deeper influences. Skewed data may indicate inequality, bias, or dependence on a small group of high-performing customers or employees. Bimodal distributions can reveal distinct segments within markets or workforces that require different strategies.Non-normal data in business research highlights inefficiencies, structural issues, or external factors such as seasonality and economic shocks. Extreme values may point to operational risks or flawed incentive systems. Instead of relying on averages, such data requires closer examination. Understanding these patterns enables business graduates to interpret research more accurately and make better-informed decisions.
How Business Graduates Can Use This to Stand Out Early in Their Careers
For upcoming business graduates, understanding normal distribution can be a powerful career differentiator.
First, it allows you to ask better questions. Instead of blindly accepting averages, you can question whether the data actually follows a normal pattern and whether conclusions are valid.
Second, it improves your analytical credibility. In internships, management trainee roles, or analyst positions, graduates who understand data distribution can interpret reports more confidently and communicate insights clearly.
Third, it helps you excel in interviews and case studies. When discussing performance metrics, quality issues, or research results, referencing concepts like variability, standard deviation, and normality instantly signals analytical maturity.
Finally, it prepares you for advanced tools and roles. Fields like financial modeling, operations management, consulting, and data analytics all rely heavily on assumptions tied to normal distribution.